
Start with the essentials
Teas grow in different environments and are made for different habits and markets. Chinese green tea, Indian and Kenyan black tea, and Sri Lankan regional teas connect climate and material with industrial choices.
This article maps origins, environmental conditions and trade flows. It explains why elevation, light and water matter, while placing production and export figures within dates and definitions. National scale and cup quality answer different questions.
Three key points
- Growing combines shared needs and local conditionsTemperature, water and soil interact, even at similar latitudes.
- Products respond to marketsPlain drinking, additions and blending influence manufacturing choices.
- Production and trade measure different rolesOutput, exports and consumption need dates and units.
Connect the region with the tea
Compare packages from two countries for origin, leaf form, manufacture and intended preparation. Place them on a map to connect the plant with different industries and drinking habits.
Macro-Geographic Layout of the Global Golden Tea Belts
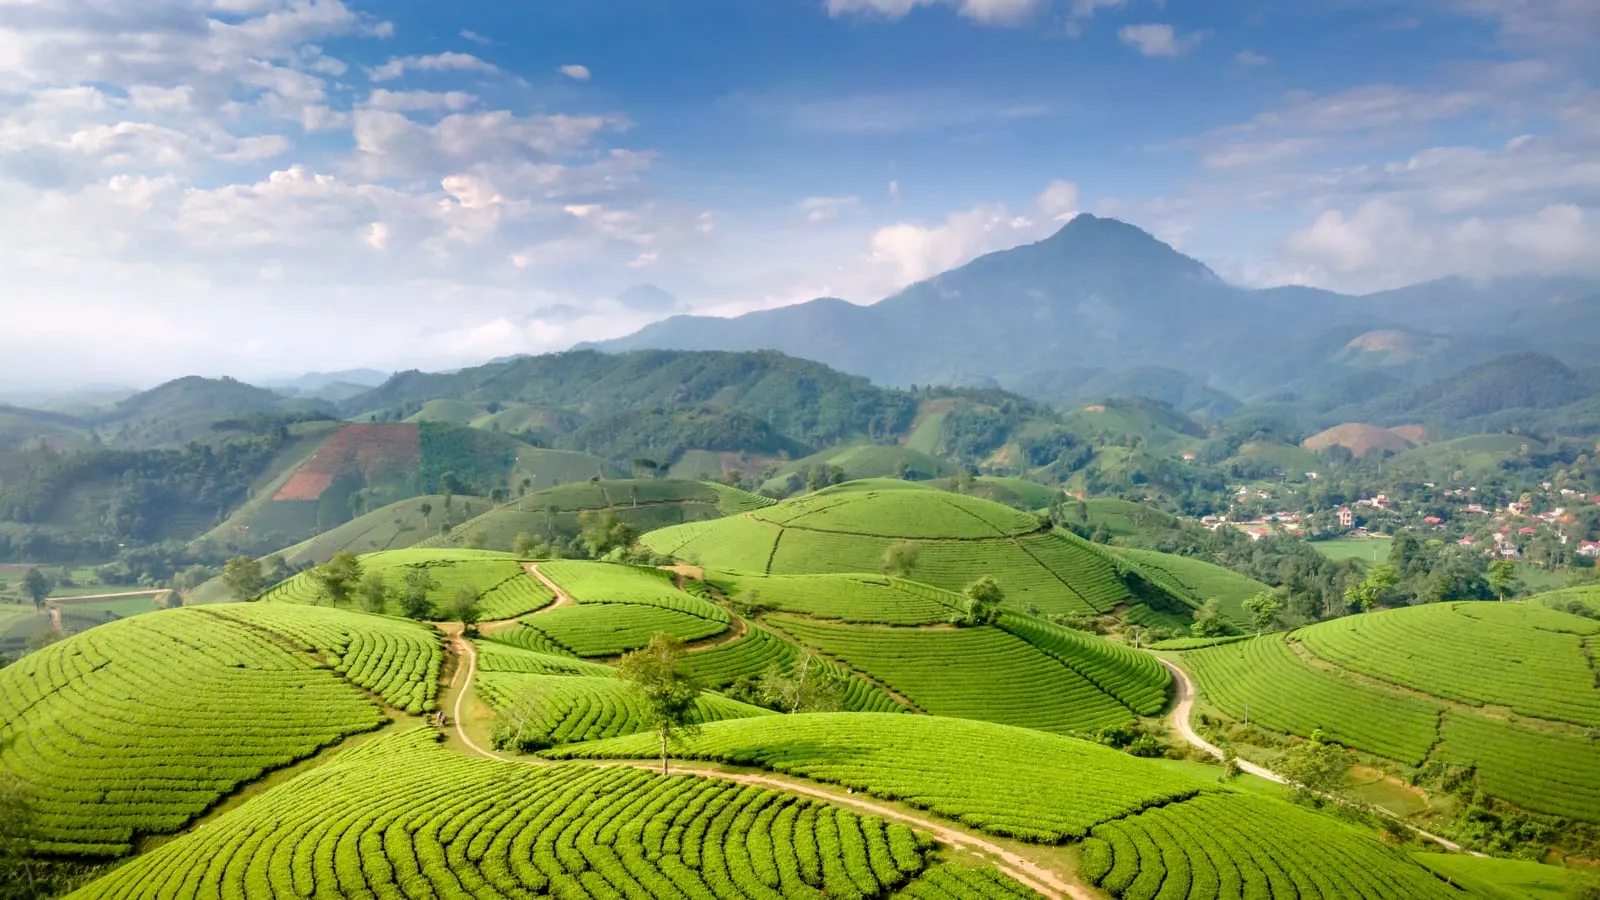
Large-scale, premium commercial tea plantations across the globe are not randomly distributed; they are concentrated within two planetary belts shaped by seasonal monsoons, topography, and global atmospheric circulation known as the “Golden Tea Belts”[1][3]:
The interactive map below features the core tea-producing nations worldwide. Hover over or tap any circle (circle diameters indicate editorial production volume bands) to explore each country’s terroir profile, cultivar foundation, dominant processing crafts, and signature teas:
World Tea-Producing Countries & Terroir Distribution Workbench
Click map markers or the country list below to explore regional terroirs, signature tea styles, and production scale bands; supports zoom and pan.
About this diagram & its limits
World tea-producing countries and trade distribution illustration · Illustrates global latitude bands, dominant tea categories, and editorial production scale bands based on FAOSTAT and national tea boards.
China
ChinaThe cradle of tea origin and tea culture; the only producer of all six traditional tea categories with immense botanical diversity.
Global Tea Origins Index
1. The 30°N Golden Tea Belt: The Pinnacle of Famous Specialty Teas
Spanning between 20°N and 35°N latitude, this corridor traverses the Yangtze River basin, the Yunnan-Guizhou Plateau, Honshu in Japan, and the southern foothills of the Himalayas. Governed by East Asian and South Asian monsoon regimes, this zone features four distinct seasons, synchronised heat and precipitation, and complex mountainous and hilly topography (300 to 2,500 m above sea level). It is the world’s premier production cradle for famed green teas, complex oolongs, and high-altitude aromatic black teas[1][2].
2. The 20°S Golden Tea Belt: The High-Yield Equatorial Highland Corridor
Ranging between 10°S and 25°S latitude (and adjacent equatorial highlands), this belt encompasses both flanks of the Great Rift Valley in East Africa (1,500 to 2,700 m altitude), the central mountains of Sri Lanka, and the Indonesian island arc. Bathed in equatorial low-pressure or southeast trade winds, these regions enjoy abundant sunshine, zero frost, bountiful rainfall, and highly fertile, porous volcanic ash soils (Andosols). The tea bush flushes year-round without winter dormancy, establishing this zone as the epicentre of global CTC black tea and high-volume export supply[3][5].
Biochemical Regulation of Fresh-Leaf Secondary Metabolism by Environmental Factors
The ancient adage that “high mountains produce famous tea” (Gao Shan Chu Hao Cha) is not mere poetic romanticism, but a measurable phenomenon grounded in microclimatology and plant photobiology[1][4]:
1. Temperature Lapse Rates and Thermal Inversion Layers
- Diurnal Temperature Range and Carbon-Nitrogen Balance: For every 100 metres increase in elevation, ambient air temperature decreases by approximately 0.6 °C. High-altitude tea gardens receive intense photosynthetic solar radiation during the day, producing abundant primary carbohydrates and proteins. At night, plummeting temperatures dramatically suppress plant respiratory consumption, maximising net dry matter and non-structural carbohydrate accumulation[1][2].
- Thermal Inversions and Leaf Tenderness: Inversion layers forming over mountain basins cushion the tea bushes against frost extremes while slowing down cellulose and lignin deposition in cell walls, keeping plucking shoots supple, fleshy, and tender over extended periods.
2. Cloud-Mist Light Filtration and Blue-Violet Diffuse Radiation (Photobiology)
Having evolved as an understory plant in subtropical primeval forests, Camellia sinensis possesses natural shade-tolerant and sciophilous adaptations:
- Spectral Quality Reconfiguration: Dense mountain clouds and valley mists selectively scatter solar radiation, reflecting and filtering longer-wavelength direct red and orange light (600–700 nm) while markedly increasing the ratio of short-wavelength blue-violet light (400–450 nm) and diffuse radiation[4].
- Enzymatic Activation & Amino Acid Accumulation: Blue-violet light activates chloroplast glutamine synthetase (GS), glutamate synthase (GOGAT), and phenylalanine ammonia-lyase (PAL), stimulating the biosynthesis of L-Theanine, aspartate, and glutamic acid.
- Optimising the Phenol-to-Amino Acid Ratio (TP/AA): Under diffuse light, the light-dependent biosynthesis of astringent catechins is moderated, and the conversion of simple catechins into harsh ester-type catechins is suppressed. This maintains the phenol-to-amino acid ratio (TP/AA) at an optimal low level of 6–8 (compared to 15–20 in low-altitude, sun-scorched plains), endowing the tea liquor with exceptional umami sweetness and eliminating coarse bitterness[1][4].
- Volatile Terpenoid Precursor Enrichment: Short-wavelength light enhances the 2-C-methyl-D-erythritol 4-phosphate (MEP) pathway, triggering multi-fold increases in volatile monoterpenols and their glycosidic precursors—such as linalool, geraniol, and nerolidol—giving high-mountain teas their signature floral, orchid, and honey aromatics[4].
3. Bedrock Weathering and Mineral Nutrition
As an acidophilic, aluminium-accumulating plant, the tea bush thrives in soils with pH 4.5–6.5:
- Trace Elements & Aromatic Precursors: Soils derived from weathered granite, porphyry, and volcanic gravel (such as Wuyi weathered rock soils and Phoenix Dancong volcanic breccia) offer superior drainage, aeration, and rich reserves of water-soluble potassium, magnesium, zinc, and selenium. These minerals serve as essential enzymatic cofactors in aroma biosynthesis, generating unmistakable “rock rhyme” (Yan Yun) and mountain terroir signatures[2].
Four Major Producing Nations and Global Trade Dynamics
With total annual global tea production exceeding 6.5 million metric tonnes, the global tea economy is anchored by four dominant producer nations, exhibiting a stark structural dichotomy between domestic-driven and export-oriented models[5][6]:
| Country | Global Output Share | Dominant Teas & Crafts | Core Terroir & Agro-Climatic Zones | Industrial & Trade Model |
|---|---|---|---|---|
| China | No. 1 (~47%) | All 6 categories; green tea leads (~60%), alongside flourishing oolong, black, dark, white | Jiangnan, South China, Southwest, Jiangbei; diverse mountainous topography | Domestic-Driven (>85% consumed domestically); artisan & semi-mechanised specialty teas, high unit value |
| India | No. 2 (~20%) | Black tea dominant; CTC crush-tear-curl (>80%) + Darjeeling/Assam orthodox | Assam river plains (tropical wet), Darjeeling (cool alpine), Nilgiris | Dual-Market (massive domestic Masala Chai consumption + major exports to UK, CIS, Middle East) |
| Kenya | No. 3 (~8%) | Black tea exclusive; virtually 100% CTC fannings and dust | Great Rift Valley plateaus (1,500–2,200 m), equatorial volcanic ash soils | Export-Driven (>95% exported; World’s No. 1 Exporter); bedrock of multinational tea bags & commercial blends |
| Sri Lanka | No. 4 (~5%) | Ceylon black tea; orthodox whole-leaf processing dominant | Central massif with 3 distinct elevation tiers (High-grown Nuwara Eliya, Medium, Low-grown) | Export-Driven (>90% exported); State-certified “Ceylon Tea Lion Logo” GI, celebrated for high-grade whole-leaf orthodox |
1. Domestic Green Tea vs Export-Oriented Black Tea Structures
- The Chinese Model: Underpinned by 1.4 billion domestic consumers and profound tea culture, China is the world’s largest consumer market. It has built a high-value, protected internal circulation network for premium specialty teas, while its exports focus primarily on classic gunpowder and chunmee green teas[5].
- The East African & South Asian Model: Countries like Kenya and Sri Lanka, with relatively modest domestic populations, depend almost entirely on maritime shipping routes and the tea auction centres of Mombasa, Colombo, and London. Their agricultural yields and climatic shifts directly dictate price movements across the global packaged tea industry[5].
Production Volume versus Specialty Terroir
Gross output volume bears no linear correlation with commercial cup quality or market price:
- Kenya commands global export leadership through high-yielding CTC estates, supplying uniform, brisk black tea pellets to multinational conglomerates like Lipton and Twinings[5];
- Conversely, Japan and Taiwan hold very modest shares of total global volume (Japan produces less than 80,000 tonnes annually), yet through meticulous, labour-intensive agricultural protocols (such as straw-canopy shading for Gyokuro, stone-milling for Uji Matcha, and heavy oxidation/baking for Dong Ding Oolong), they command extraordinary price premiums across the international specialty tea arena[6].
See also
- China’s Four Great Tea Regions — macro-terroir divisions across China’s vast tea landscape
- World Tea Regions · Indian Tea — Assam plains and Darjeeling’s Himalayan champagne of teas
- World Tea Regions · Sri Lanka — elevation agro-climatic zones and the Ceylon Lion seal
- World Tea Regions · Kenyan Tea — equatorial highlands, volcanic soils, and industrial CTC miracles
- World Tea Regions · Japanese Tea — steam fixation, kabusecha shading, and refined matcha terroir
- The Tea Plant: Botany — morphological varieties, root physiology, and soil preferences
- Fresh-Leaf Chemistry — theanine pathways, catechin balance, and aroma precursors
References
- R-042 — 庄晚芳 主编 (1988).《中国茶树栽培学》. 上海科学技术出版社. ISBN: 978-7532304899.
- R-030 — 陈宗懋 主编 (2000).《中国茶叶大辞典》. 中国轻工业出版社. ISBN: 978-7501925094.
- R-134 — Willson, K. C., & Clifford, M. N. (1992). Tea: Cultivation to Consumption. Chapman & Hall.
- R-029 — 宛晓春 主编 (2003).《茶叶生物化学》(第3版). 中国农业出版社. ISBN: 978-7109066274.
- R-232 — FAO Intergovernmental Group on Tea. Current global market situation and emerging issues (CCP:TE 22/CRS 1), 2022. https://www.fao.org/3/cc0238en/cc0238en.pdf
- R-140 — Bore, J. K. (2008). The Effects of Mechanisation on Tea Quality in Kenya. Tea Research Foundation of Kenya.
Article Knowledge Network
Explore the connections between the teas, processes and flavours in this article.